Profile annotations
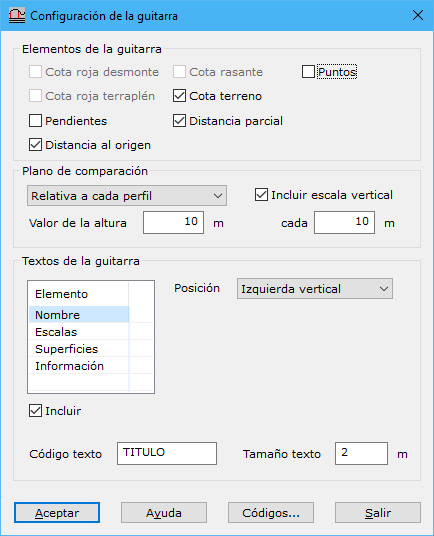
This dialog configures the frame containing a longitudinal profile and the additional information displayed in it.
At the top, select the elements to include in the lower part of the frame, the data bands. These fields are filled automatically from calculated profiles:
- Cut/fill depth: difference between design and ground elevations. If design elevation is below ground elevation, the difference represents cut; otherwise, fill.
- Design/ground elevation: elevation of the design grade or digital terrain model.
- Partial distance and distance from origin: distance in meters from the profile origin or the last point referenced in the data bands.
- Points: profile point number.
Configure the frame's comparison plane and optional vertical scale with these fields:
- Plane of comparison: how its elevation is calculated. Absolute uses Height value directly. Relative to each profile subtracts Height value from each profile's lowest elevation. Relative to all profiles subtracts it from the lowest elevation across all profiles. With Absolute, a profile's minimum elevation may fall below the specified value. A dialog then lets you resolve the conflict.
- Height value: absolute or relative comparison plane elevation, in meters.
- Include vertical scale: draws horizontal lines parallel to the comparison plane to aid reading elevations. Specify their spacing in the field below.
Set codes for the annotation frame itself using Annotation code and Internal line code.
Finally, select the texts to display inside and around the frame. Enable Include below the list for each desired text. Its parameters then appear; except for Information texts, all share:
- Position: text position around the profile frame.
- Text code: code for recording the text.
- Text height: text height in meters.
Available texts:
- Name: profile name.
- Scales: horizontal and vertical scales specified in the Profiles dialog.
- Areas: if a design grade is available, calculates and displays cut and fill areas.
- Information: texts for fields selected at the top, displayed as data bands below the frame. These use different settings:
- Distance from origin: distance in meters from the first longitudinal profile point's origin.
- Distance from last point:
- Information: includes information at every profile change of direction, provided labels do not overlap, or at a specified distance interval.